Getting started with AI video is exciting - but creating videos is only half the story. The real power lies in understanding how those videos perform. Analytics turn your AI videos from creative assets into data-driven tools that can inform strategy, improve engagement, and prove ROI.
In this guide, we’ll explore how to measure the performance of your AI videos using analytics - and how Colossyan’s built-in analytics dashboard helps you track key metrics like completion rates, engagement, and user interactions to continuously improve your content.
Why Measuring AI Video Performance Matters
When you start using AI-generated video, it’s easy to focus on production speed and scalability - both major advantages of platforms like Colossyan.
But the real value comes when you use analytics to understand how your audience engages with those videos, and where you can scale/change your approach.
Whether you’re training employees, onboarding customers, or sharing internal updates, analytics help you answer crucial questions:
-
Are viewers watching the entire video or dropping off halfway?
-
Which videos drive the most engagement or interactivity?
-
How does performance vary across topics, teams, or departments?
By tracking and interpreting these insights, you can optimize your content for higher retention, better learning outcomes, and stronger impact.
Key Metrics To Track In AI Video Analytics
If you’re just starting out, focus on a few core metrics that give you the clearest picture of how your videos are performing.
1. Completion Rate
This is one of the most important metrics - it tells you what percentage of viewers watch your video from start to finish.
With Colossyan’s analytics, you can easily see where viewers drop off. For example, if most people stop watching halfway through, you might shorten your videos or move key information earlier.
2. Engagement and Interaction
Beyond watch time, interactive elements like quizzes, clickable buttons, or branching scenarios reveal how actively viewers participate.
Colossyan tracks these user interactions directly, allowing you to identify which parts of your video hold attention and which might need refinement.
3. Playback and View Data
Basic metrics like total plays and average watch time help you assess reach and interest.
Colossyan’s video analytics present this data in clear visual dashboards - perfect for spotting trends and comparing performance across different videos or audiences.
4. Feedback Loops and Iteration
Analytics aren’t just for reporting - they’re for improvement.
By reviewing Colossyan’s performance data, you can quickly iterate on your videos: adjust tone, rephrase instructions, or test different formats. This continuous cycle turns your AI video strategy into a measurable, evolving system.
How Colossyan Simplifies AI Video Analytics
How Sonesta cut 80% of video production costs
Sonesta replaced traditional video production with Colossyan's AI avatars, cutting costs by 80% while scaling content across their hotel properties.
Read the full story →At Colossyan, we designed our analytics to make performance tracking simple, visual, and actionable - especially for teams that are new to AI video.
Built-In Dashboard
Every video you create comes with a built-in analytics view that shows:
-
**Completion rates
**
-
**Total views
**
-
**Average watch time
**
-
Interactions (like quiz responses or button clicks)
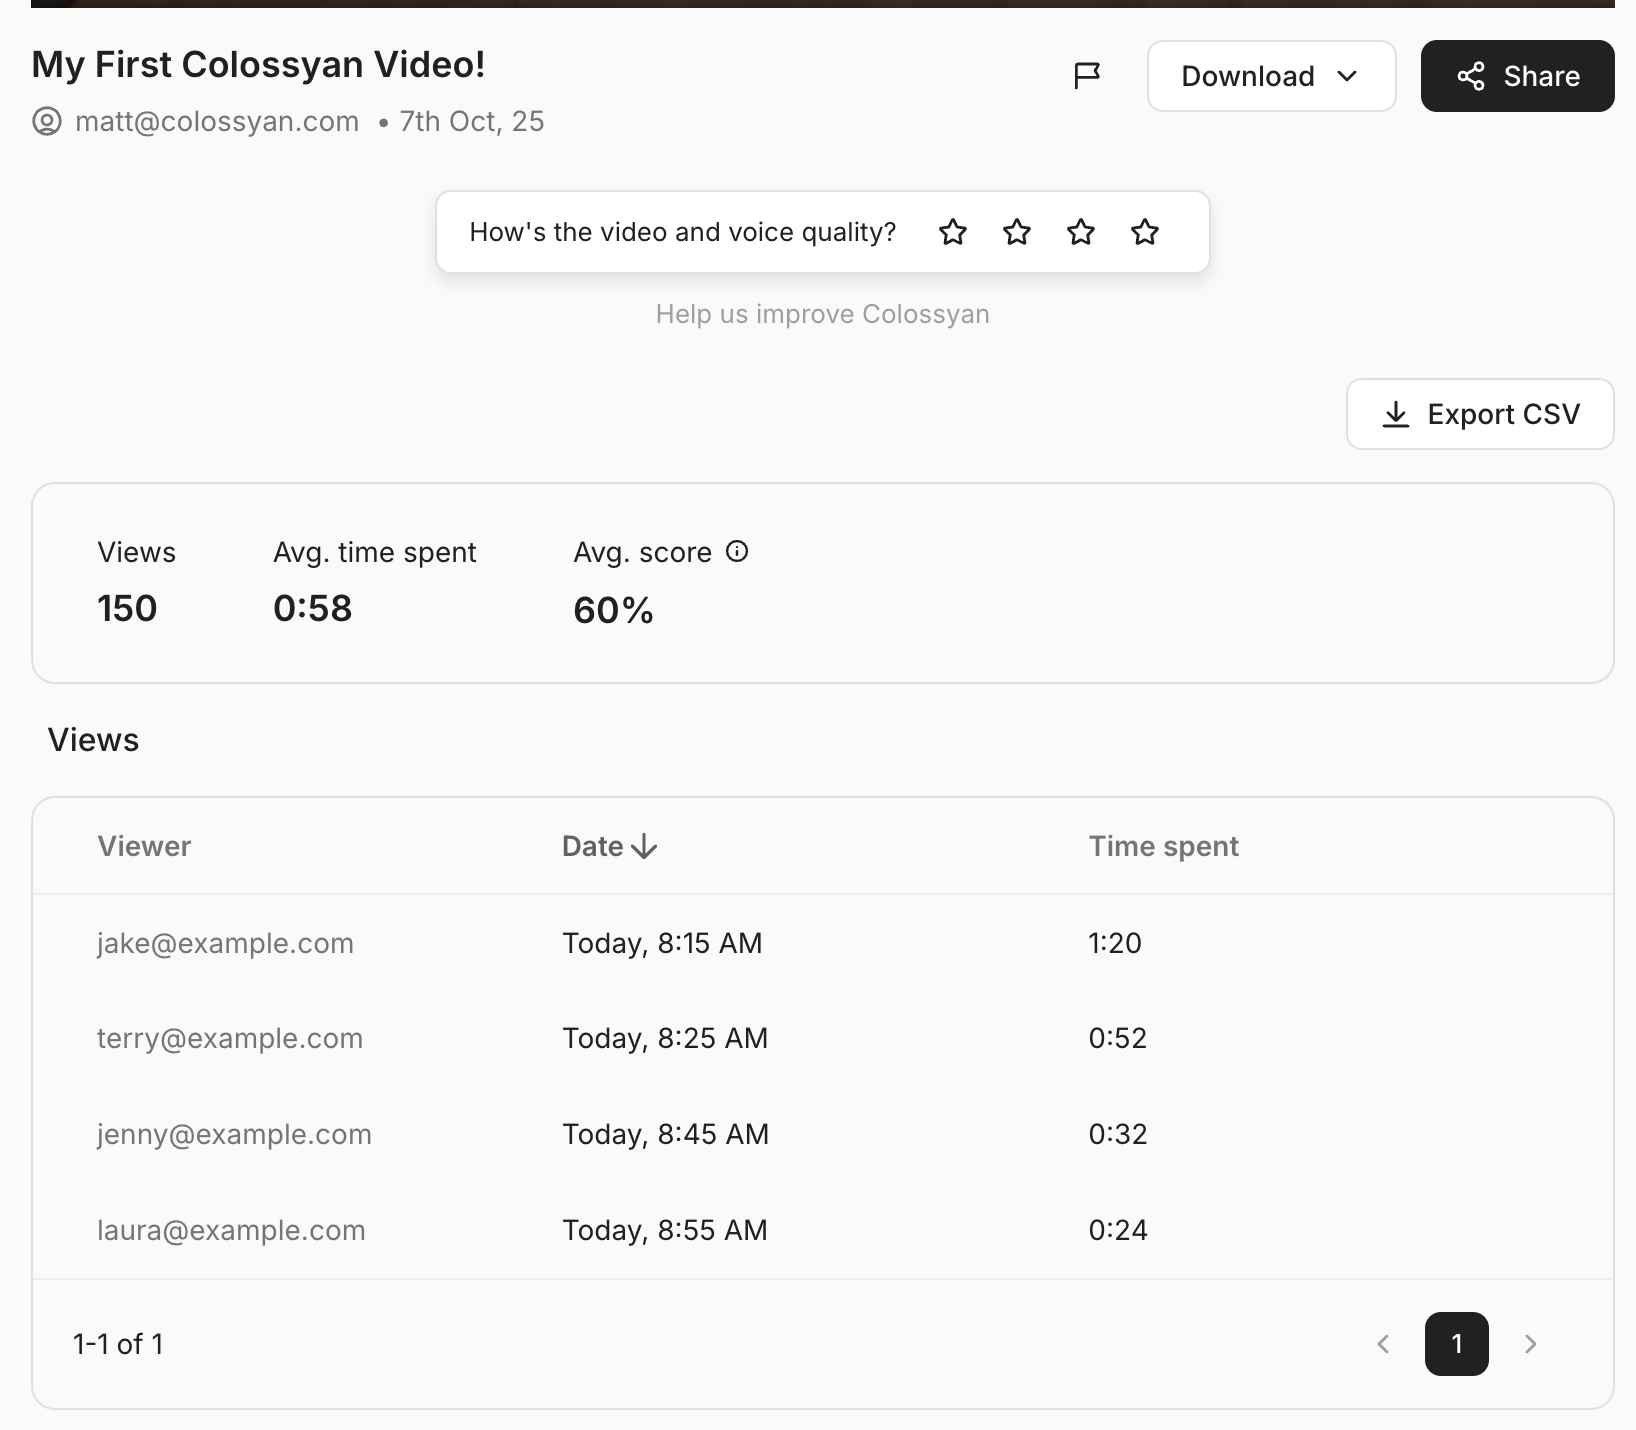
You don’t need external tools or integrations - everything is available directly in your workspace.
Insights That Drive Decisions
Colossyan’s analytics help L&D teams and content creators:
-
Identify which training videos are most effective
-
Pinpoint where learners lose attention
-
Validate that AI-generated videos are achieving desired outcomes
With these insights, you can confidently adjust your content strategy and demonstrate measurable success to stakeholders.
Turning Data Into Action
Analytics aren’t just about collecting numbers - they’re about taking smart action.
Here’s how you can make the most of your Colossyan analytics data:
-
Set clear goals: Decide what success looks like - e.g., 80% completion rate or 90% quiz accuracy.
-
Review regularly: Use Colossyan’s dashboard to monitor performance over time.
-
Experiment: Try different video lengths, tones, or AI avatars to see what works best.
-
Iterate: Apply insights to refine your future content, creating a continuous feedback loop.
Conclusion: Data-Driven AI Video Success Starts With Analytics
AI video is transforming how we communicate, train, and educate - but without analytics, it’s impossible to know what’s truly working.
By using Colossyan’s built-in analytics, even beginners can measure completion rates, analyze engagement, and make data-informed decisions that lead to better outcomes.
In short: if you can measure it, you can improve it. And with Colossyan, measuring your AI video performance has never been easier.