Learning management system analytics is all about collecting, measuring, and analyzing the data from your training platform to figure out what’s working and what isn’t. But let's be frank: the data your LMS provides is often just the tip of the iceberg. To prove real value, you need to find strategic insights that tie your learning initiatives directly to real, measurable business outcomes—and that requires looking deeper.
Why Your LMS Data Is Only Half The Story
Your Learning Management System (LMS) is the backbone of your L&D program. It excels at tracking the basics: course completions, login times, and quiz scores. This data gives you a fundamental checklist of learning activity, which is essential for compliance and basic reporting.
But relying on that data alone is like knowing a salesperson made a hundred calls without knowing if a single one actually connected with a prospect. It tracks activity, but it fails to measure genuine engagement and comprehension. This creates a critical data gap that prevents you from proving the true business impact of your training.
The Pilot's Cockpit Analogy
Think of your LMS dashboard as a pilot's cockpit. The standard metrics—like completion rates—are your altitude and speed gauges. They’re critical for confirming you’re airborne and moving forward. But a pilot needs far more than that to navigate safely and efficiently.
They need deeper sensor data on engine performance, upcoming turbulence, and fuel consumption. This richer information allows them to make smart, proactive decisions instead of just reacting to alarms. In the same way, learning management system analytics must be augmented to provide this deeper layer of insight for L&D teams.
Your LMS tells you if a course was completed. Deeper analytics tell you how it was completed, revealing the story behind the numbers and showing what truly clicks with your learners.
Uncovering The Engagement Black Box
The most valuable learning moments, especially inside video content, often happen in a data ‘black box’ that standard LMS platforms can’t see into. For example, your system can confirm a learner watched a video, but it can’t tell you if they:
Re-watched a complex section three times until they finally got it.
Skipped over a critical safety procedure because they thought they already knew it.
Paused frequently, which might suggest the content was too dense or confusing.
This is the central argument: your existing tools are good, but they have a blind spot. The LMS tracks the container (the course) but completely misses the quality of engagement with the content inside.
With the global learning management system market projected to explode from $34.09 billion in 2026 to an incredible $123.78 billion by 2033, the demand for more sophisticated, data-driven learning is undeniable. You can read more about these market projections to get a sense of where the industry is headed.
This is where a specialized tool like Colossyan becomes a strategic partner. It isn’t about replacing your LMS; it’s about augmenting it. By integrating Colossyan, you can feed granular video engagement data directly back into your existing system, finally giving you the complete picture of how learning is actually happening. To learn more, check out our guide on how to ensure LMS employee training success.
Decoding Your Foundational LMS Metrics
Think of your Learning Management System dashboard as the health monitor for your training programs. It gives you the basics—the foundational learning management system analytics like completion rates, quiz scores, and how long someone spent on a course. Getting a handle on what these signals truly mean is the first step to understanding the real health of your L&D initiatives.
On the surface, these numbers seem pretty black and white. A high course completion rate must be good, right? Low scores must be bad. It’s easy to jump to those conclusions.
But these surface-level metrics can be deceiving. They’re great at telling you what happened, but they almost never tell you why. For any L&D team that wants to prove its worth, the argument for digging into that "why" is absolutely essential.
Looking Beyond The Surface Numbers
Let's take a common metric: "Time Spent on Course." A big number here could mean learners are deeply engaged. Or, it could be a massive red flag that your content is confusing, poorly designed, or just plain broken, forcing people to struggle their way to the finish line.
And what about that celebrated 100% completion rate? Does it mean the learner absorbed every detail, or did they just mindlessly click "next" on a 100-slide deck to get credit? To the LMS, both scenarios often look exactly the same.
Standard LMS metrics often treat a dense technical document and a short, interactive video as equivalent 'learning objects.' This approach completely fails to capture the immense difference in actual engagement and knowledge transfer between the two.
This points to a huge data gap that holds your L&D strategy back. Your LMS can tell you a task is "done," but it has no idea about the quality of the learning experience itself. Relying on basic numbers alone isn't just incomplete; it can be downright harmful, a topic we explore in our article on why vanity metrics are killing your L&D strategy.
The Problem With One-Dimensional Data
The biggest issue with foundational LMS metrics is that they're one-dimensional. They track access and completion, but they fall flat when it comes to measuring genuine interaction, understanding, and engagement—especially with dynamic content like video.
Before you take your LMS data at face value, let's break down what some of these common metrics could really be telling you.
Key LMS Metrics And Their Business Implications
This table cuts through the noise to show you what your basic LMS data might actually signify for your L&D strategy and, more importantly, for the business.
As you can see, without more context, these numbers raise more questions than they answer. Is a high quiz pass rate a sign of effective content, or are the questions just too easy? Does a low course access rate mean the content is bad, or was the communication about the training just poorly executed?
To get a clearer picture, it helps to borrow a page from a different playbook. Consider how teams measure essential customer success metrics—they don't just track if a customer logged in; they look at usage patterns and sentiment to gauge health. We should treat our learners the same way.
This gap is precisely where the argument for augmenting your LMS becomes clear. To move forward, you need specialized analytics tools that provide the missing context, turning your LMS from a simple tracking system into a true strategic asset.
Unlocking The Black Box Of Learner Engagement
As L&D professionals, we love seeing high completion rates. They look great on a report. But let's be honest with ourselves: a completion rate is often a vanity metric, telling us very little about whether someone actually learned anything.
Your Learning Management System might diligently report that a learner "completed" a training video, which is great for ticking a compliance box. But it stays completely silent on the questions that really matter.
Did they hit play and then turn their attention to a second monitor full of emails? Did they skip the critical safety procedures, figuring they already knew that part? Or did they rewind that one complex explanation three times until the concept finally clicked? This is the engagement 'black box'—that unobserved space where real learning either happens or fails to happen.
The Library Analogy
Think about your LMS like a library's checkout system. It's fantastic at telling you that a book was borrowed on May 1st and returned on May 15th. That’s useful for tracking basic activity, but it reveals absolutely nothing about the reader's experience. Was the book even opened? Did the reader understand it? Did they find it valuable?
A specialized video analytics tool, on the other hand, is like getting to see that reader's personal copy. You can see the pages with highlighted passages, the notes scribbled in the margins, and the dog-eared corners marking sections they wanted to revisit. This is the fundamental difference between tracking access and truly understanding engagement.
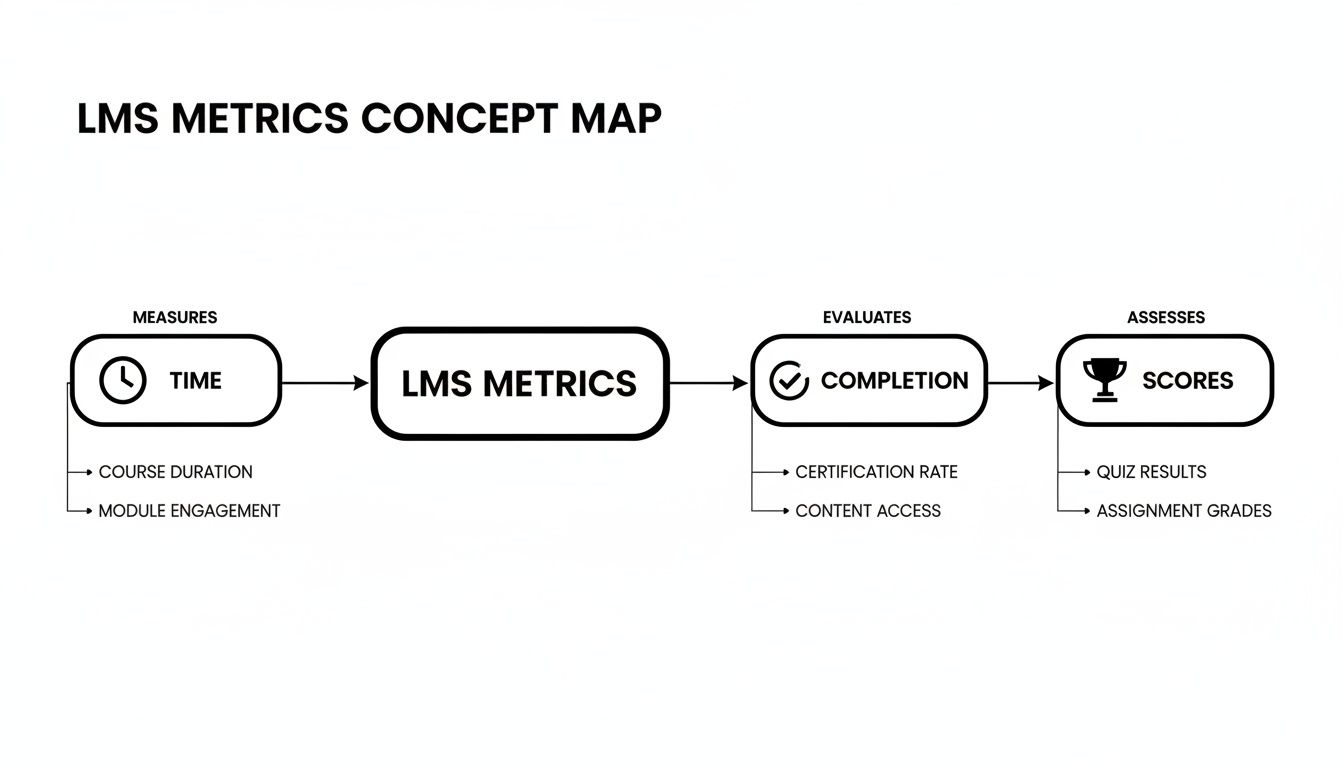
This graphic shows some of the typical metrics most LMS platforms can give you.
They're a decent starting point, for sure. But these metrics barely scratch the surface of genuine comprehension.
Bridging The Data Gap With Deeper Analytics
To get beyond surface-level learning management system analytics, we have to peer inside that black box. All the most meaningful interactions—the moments of confusion, the "aha!" moments of clarity, the flickers of genuine understanding—are completely invisible to a standard LMS. These are the data points you actually need to improve your training and prove it's working.
The biggest failure of traditional LMS reporting is its inability to distinguish between passive consumption and active comprehension. A checkmark for "complete" says nothing about the quality of the learning experience.
This is exactly why tools that specialize in video learning are so critical. It’s not about ripping out and replacing your LMS. It's about augmenting it with the high-fidelity data it was never built to capture in the first place.
How Colossyan Enhances Your Existing Tools
This is where Colossyan’s SCORM integration becomes a game-changer for your L&D strategy. Instead of forcing your data into a separate silo, our platform pipes rich, granular video engagement data directly back into your LMS. Suddenly, your system transforms from a simple record-keeper into a powerful hub of deep learning insights.
Imagine having this kind of data right inside your existing workflow:
Re-watch Rates: Pinpoint the exact segments of a video that are being viewed over and over. This is a massive tell—that content is either incredibly valuable or it's confusing and needs to be clarified.
Watch Time Heatmaps: See a visual map of where learners are paying attention and where their interest drops off. Are they consistently skipping the first 30 seconds and jumping straight to a demo? That insight alone can help you structure future videos far more effectively.
In-Video Quiz Performance: Go way beyond a simple pass/fail. You can see which specific questions trip people up, revealing knowledge gaps that your training needs to address more directly.
Engagement Scores: Get a single, holistic score that combines views, completions, quiz results, and other interactions into one meaningful metric. It reflects true engagement, not just access.
By enriching your LMS with this level of detail, you stop just managing courses and start actively improving them based on real user behavior. You can finally pinpoint the exact moment a concept fails to land, identify your most effective training content, and make data-driven decisions that boost learner comprehension across the board. The black box is finally unlocked.
Moving From Reactive Reporting To Proactive Strategy
So far, we’ve seen how standard learning management system analytics tell you what’s already happened. They confirm who finished a course, what their score was, and how much time they spent. This is useful for compliance and record-keeping, but it's fundamentally reactive. You’re always looking in the rearview mirror.
But what if you could see the road ahead? What if you could spot a learner who is starting to struggle before they fail the final quiz? This is the critical jump from backward-looking reports to a forward-thinking, proactive strategy. The argument is simple: L&D must evolve from a team that reports on last month's completion rates to a strategic partner that steps in to help someone this week.
This shift is powered by predictive analytics, an area that’s quickly becoming a major focus for modern learning teams. The trend is impossible to ignore.
Predictive learning analytics has emerged as the fastest-growing domain within learning analytics since 2019. This explosive growth reflects the industry's shift from reactive reporting to proactive intervention capabilities, using historical learner data to forecast future outcomes and fundamentally transform how organizations approach learner support. You can explore more about the rise of predictive analytics in corporate learning to understand its impact.
Moving toward forecasting isn't just a shiny new trend; it’s a strategic must for L&D teams trying to prove their value and directly impact business performance.
Fueling Predictive Models With High-Quality Data
A predictive model is only as smart as the data you feed it. Think of it like a weather forecast. If a model only knows yesterday's temperature, its prediction will be a vague, often wrong guess. But feed that same model real-time data on wind speed, barometric pressure, and humidity, and it can predict a coming storm with startling accuracy.
Your typical LMS data—login frequency, course progression—is like yesterday's temperature. It’s a start, but it lacks the depth needed for truly accurate predictions. To build reliable models, you need higher-fidelity data that captures the tiny, subtle moments of the learning process. This is where Colossyan makes the argument for itself, providing the deep engagement metrics your predictive models need.
These rich signals from video interaction provide exactly this kind of high-fidelity data.
Hesitation on a Quiz Question: When someone pauses for a long time before answering a question in a video, it’s a powerful sign they're uncertain or have a knowledge gap.
Re-watching a Key Demo: If a learner keeps replaying a specific segment, it tells you that content is either incredibly valuable or particularly difficult—both are critical insights.
Skipping Introductory Sections: Seeing most learners jump past the first minute of a video is a clear signal that your intro isn't landing, giving you a chance to make it better next time.
Empowering L&D To Act Proactively
When you feed this granular engagement data from a tool like Colossyan back into your analytics ecosystem, your predictive power grows exponentially. You move beyond simple correlations and start uncovering complex patterns that signal who is likely to succeed and who might be struggling.
This gives your team the power to take specific, proactive steps that make a real difference. For example, imagine your data shows that learners who re-watch a specific product demo more than three times tend to score 20% higher on their final assessment. You can immediately build that insight into the course, proactively recommending that segment to all new learners.
Or, on the flip side, if learners who fail an in-video quiz on a compliance policy are later flagged for procedural mistakes on the job, you can set up automated interventions. The system could trigger a follow-up micro-learning module or alert a manager to schedule some one-on-one coaching. This kind of support doesn't just improve course outcomes—it helps prevent costly mistakes, optimize your content, and ultimately maximize the return on your entire training investment.
Putting Your Enriched Learning Data To Work
The argument for better data is won when it hits the bottom line. Enriched learning management system analytics aren't just for building prettier reports; they're for solving real, nagging business problems. When you blend standard LMS data with deep video engagement metrics from Colossyan, you create a powerful feedback loop connecting learning directly to performance.
And organizations are already deeply committed to this approach. A staggering 83% of organizations are actively using an LMS. In fact, LMS programs make up 89% of all deployed learning technologies—that’s more than double the adoption of rapid e-learning tools (44%) or mobile apps (31%).
This heavy reliance makes your LMS the perfect hub for this richer data. The argument isn't to replace it, but to supercharge it.
Supercharging Sales Enablement
Top-tier sales teams run on training that is razor-sharp, relevant, and actually works. By folding detailed video analytics into your LMS, you can stop asking if a salesperson completed a product video and start asking what they understood.
Problem: The sales team's performance is all over the map. You can’t tell which parts of the product training are landing and which are being glossed over, making it impossible to connect your training efforts to actual sales numbers.
Solution with Colossyan: You create product training videos in Colossyan and integrate them into your existing LMS. Now you can see heatmaps showing which product features get re-watched the most and which are skipped. In-video quiz scores pinpoint specific knowledge gaps before they become on-the-job problems.
Outcome: You correlate this deep engagement data with your CRM performance data and find a telling pattern: your top reps consistently re-watch the "Objection Handling" module. Boom. You redesign the sales onboarding path to make that module mandatory and even expand it. The result is a more confident, better-equipped sales team and a measurable lift in close rates.
Accelerating New Hire Onboarding
Getting new hires up to speed isn't just a nice-to-have; it's a huge competitive advantage. Your standard LMS data can confirm a new employee checked the box on their compliance videos, but it tells you nothing about their comprehension or confusion.
The goal of onboarding isn't just completion; it's competence. Deep video analytics help you measure understanding, not just activity, dramatically shortening a new hire's time-to-productivity.
This targeted approach helps you spot and fix confusing content, ensuring new team members are truly ready to contribute. Platforms that use advanced LLM technology can take this even further, providing deeper insights and automating much of the analysis.
Reducing Customer Support Tickets
Smart customer education is one of the best ways to lighten the load on your support team. When customers understand your product, they have fewer basic questions, freeing up your agents to tackle the truly complex issues.
Problem: Your support team is drowning in tickets about the same basic product features. You have a whole library of video tutorials in your customer-facing LMS, and completion rates look great, but the ticket volume isn't budging.
Solution with Colossyan: By augmenting your LMS with Colossyan, you dive into the in-video quiz data from your most-viewed tutorials. The analytics reveal a glaring issue: a massive percentage of users consistently fail the same question about configuring a specific setting. The video is clearly not landing.
Outcome: Armed with this crystal-clear insight, you use Colossyan to quickly update that section of the video with a better explanation and visuals. Within a few weeks, support tickets related to that feature drop by 40%. You've just drawn a straight line from a learning intervention to a core business metric, proving undeniable ROI. If you want to dig deeper, you can calculate your ROI and save on time-to-value with our guide.
Building a Data-Driven Learning Culture
The ultimate argument for better learning management system analytics isn't just about the tools; it's about building a culture of continuous improvement. Data on its own doesn't do much. It's the commitment to asking tougher questions—and actually acting on the answers—that moves the needle.
Your LMS is your non-negotiable system of record. It’s the source of truth for course assignments, compliance checks, and all the foundational metrics you can't live without. Think of it as the structural backbone for your entire L&D operation. But its real power is unlocked when you pair it with tools that tell you the story behind the numbers.
Completing Your Analytics Ecosystem
This brings us full circle. A tool like Colossyan isn't designed to replace your LMS; it’s a strategic partner that completes your analytics ecosystem. It shines a light on the blind spots—the critical gaps in visibility that keep you from understanding what genuine learner engagement looks like.
Here's an analogy: Your LMS tells you the training package was successfully delivered to the right employee. That’s essential. But Colossyan tells you if they opened the box, used what was inside, and found it valuable. You need both pieces of that puzzle to see the complete picture of success.
Stop looking at your LMS as just a content library. Start seeing it as the central nervous system for a smarter, more responsive learning strategy—one that is constantly fed with rich, actionable data from Colossyan.
Connecting Learning to Business Outcomes
When you start pulling deep engagement data from Colossyan into your central LMS, you can finally graduate from vanity metrics. Instead of just reporting on who completed what, you can confidently draw a line between specific learning activities and tangible business results.
Imagine showing your leadership team how employees who re-watched a specific product demo had a 15% higher sales close rate. Or demonstrating that clarifying one confusing compliance video led to a 30% reduction in procedural errors.
This is the real purpose of a data-driven culture. It’s about arming yourself with the evidence to prove your department's value, justify your budget, and build training that doesn't just get finished—it truly performs. By embracing this holistic view, you equip your organization to learn faster, adapt quicker, and hit its most critical goals.
Frequently Asked Questions
Jumping into the world of learning management system analytics can feel a bit overwhelming, especially once you start mixing traditional LMS data with richer video insights. Let's tackle some of the most common questions L&D teams have.
Where Should I Start With Improving My LMS Analytics?
The best place to start isn't with learning metrics, but with business objectives. Before you track a single 'completion,' ask yourself, 'What real-world result should this training drive?'
Maybe you want to see fewer safety incidents or help your sales team close more deals. Tying your learning goals to concrete KPIs is the absolute first step. Once you know what success looks like, you can set up your LMS and any other tools to capture the data that actually tells that story.
How Can I Justify Adding Another Tool To Our LMS?
The argument isn't about adding another tool; it's about maximizing the ROI of your biggest L&D investment—your LMS. Frame Colossyan as a force multiplier that unlocks the true value of your current system. Your LMS is great at telling you if someone completed a training, but Colossyan tells you how effective that training actually was.
When you can pinpoint exactly where learners get confused, identify engagement drop-offs, and directly link training activity to performance improvements, you're building a powerful business case. Show your leadership how these insights cut down on retraining costs or speed up time-to-competency, and the investment practically justifies itself.
The strongest case you can make is connecting specific video engagement metrics—like re-watch rates on a tricky product demo—directly to better performance KPIs. That’s how you show undeniable ROI.
Our LMS Already Has Video Analytics. Why Do We Need More?
It's true that most built-in LMS video players offer some basic metrics, usually just 'video started' or 'video finished.' But that's only scratching the surface. Specialized platforms dig much, much deeper to give you data you can actually use.
Think heatmaps that show you exactly which parts of a video learners re-watch or skip, scores on in-video quizzes, and engagement with interactive branching paths. This isn't just about tracking views; it's about understanding comprehension, not just consumption. For any kind of critical training, that distinction is everything.
At Colossyan, we're all about enhancing your LMS by unlocking the deep video engagement data needed to prove your training's impact. It's time to create more effective, data-driven learning experiences by turning insights into action. Discover how Colossyan can augment your learning analytics today.
Nikitas leads brand and content at Colossyan, shaping how knowledge is communicated, experienced, and scaled. He spends most of his time fighting unnecessary complexity and reminding people that clarity is not boring.
Networking and Relationship Building
Use this template to produce videos on best practices for relationship building at work.
Oops! Something went wrong while submitting the form.
example
Thank you - your video is on its way!
If you’d like to try out Colossyan and create a video yourself, just visit our website on your desktop and sign up for a free account in seconds. Until then, feel free to check out our examples.


.avif)


%20(1).avif)


.webp)